Last updated: 08 May 2026
UK Energy Transition: Supporting statistics and evidence
The UK’s transition to clean, affordable and secure energy is already well underway. This page brings together key statistics and evidence on the factors shaping energy bills, the role of different energy sources, and how the energy system is evolving over time.
Check back for latest, and let us know if something is missing by emailing press@energy-uk.org.uk
What is the cause of high energy bills?
- While there have been increases in some of the additional costs added to energy bills (such as network costs), the price of gas was still the biggest driver of the overall increase seen since 2021. (UKERC, 2026)
- The annual electricity bill for a typical household has risen by £166 since 2021. After adjusting for inflation, two-thirds of this increase (£112) is due to higher wholesale gas prices. (Carbon Brief, 2026)
The rise of renewable electricity and its impact on lowering prices
- Wind power has already lowered UK power prices by nearly a third. Average “day‑ahead” electricity prices in 2025 were about £83/MWh but without wind generation, it’s estimated that prices would have been £121/MWh. This £38/MWh saving represents a 31% reduction on the no‑wind price. (ECIU, 2026)
- Had the 8.4GW of offshore wind secured at the beginning of 2026 (Allocation Round 7) been operating last year, gas power generation could have been a third (35%) lower, cutting “day-ahead” wholesale prices by up to £11/MWh (13%). (ECIU, 2026)
- Renewables (wind, solar, hydro and biomass) delivered a record 44% of UK electricity in 2025, led by wind as the single largest source of generation for the second year in a row – accounting for almost 30% of electricity. (NESO, 2026)
- The rising share of renewables means the grid is running on increasing levels of zero carbon power, with a record high of 98.8% set on 22 April between 3:30pm-4:00pm. Gas reached a historic low of 1.2% of the energy mix on the same day. (NESO, 2026)
Energy security and dependence on imports
- In 2025, the UK’s electricity supply was the most British in decades. Only 46% of the primary energy used to generate electricity was imported – the lowest share since 2004, and down from 67% in 2013. This reflects a sharp fall in imported gas used for power generation, as UK wind and solar now supply electricity directly without relying on overseas fuel. (ECIU, 2026)
- Without renewable electricity from UK wind, water and sunshine, the UK would have had to import 73% – of the primary energy used to generate the electricity it needed in 2025. (ECIU, 2026)
- The roughly 15GW of wind and solar secured in the 2026 UK renewable auction will avoid the need to import 78 tankers full of liquified natural gas (LNG) each year by 2030 – worth roughly £4 billion at current gas prices. (Carbon Brief, 2026)
- Wind generation hit a new record for March 2026, up 38% year-on-year. Between them, wind and solar generated 11TWh of electricity in March 2026 – enough to power three million homes for a whole year. (Carbon Brief, 2026)
- This record output avoided the need to import 21TWh of gas – roughly 18 fully loaded LNG tankers and enough to supply 1.8 million homes for a year. At current high prices due to conflict in the Middle East, this would have cost around £1 billion. (Carbon Brief, 2026)
Macroeconomic framing (Net Zero vs fossil fuels)
- The total cost of Net Zero by 2050 is less than that of a single fossil-fuel price shock. (Climate Change Committee, 2026)
- Net-zero investment is also known to deliver strong returns for the economy, with £2–£4 of benefits for every £1 invested. (Climate Change Committee, 2026)
Embracing the energy transition at home
- This support is reflected in the uptake of small-scale renewables across the country. Almost 370,000 solar, heat pump and battery storage installations took place across homes and small businesses in 2025 – that’s one every 90 seconds. (MCS, 2026)
- Solar has proved to be consistently popular, with more than 27,000 solar installations completed in March 2026 alone. This is the highest monthly deployment of solar in over a decade and was driven mainly by rooftop solar, with one installation completed roughly every three minutes. (DESNZ, 2026).
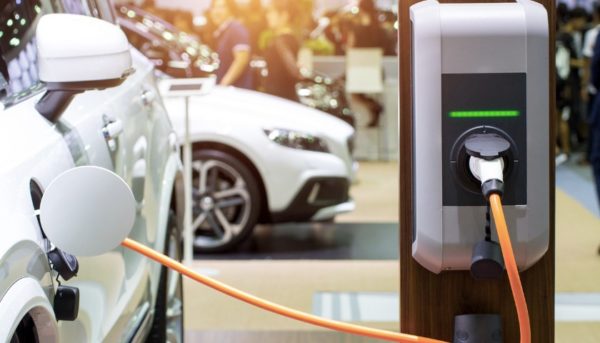
- April 2026 marked a significant milestone as the number of battery electric cars topped two million following bumper growth of 59.1% compared with 2025 (SMMT, 2026). That represents over 5% of all cars in the UK (Zapmap, 2026), with around one in four buyers going electric (SMMT, 2026).
- It took 14 years to go from 0 to 1 million EVs on the road, then two years to go from 1 to 2 million. (RAC, 2026)
- According to Autotrader, new electric cars are cheaper than petrol – average new petrol car is £43,405 compared to £42,620 for an EV. (Autotrader, 2026)
Public support for the energy transition
- Most people still support taking action on climate. (Climate Outreach, 2025)
- Polling shows consistently high support for renewables, including wind and solar. (Climate Barometer, 2026)
- Support for renewable electricity generation comfortably outpaces opposition across the political spectrum, even when projects are local with three in five Britons supporting local renewable energy projects. The public are more likely to see renewables as essential to energy security than fossil fuels. (Climate Barometer, 2026)
- MPs significantly underestimate public support for renewables. For example: 73% of the public support a local solar park, but MPs typically estimate support to be as low as 16%. (Climate Barometer, 2026)
Check back for latest, and let us know if something is missing by emailing press@energy-uk.org.uk